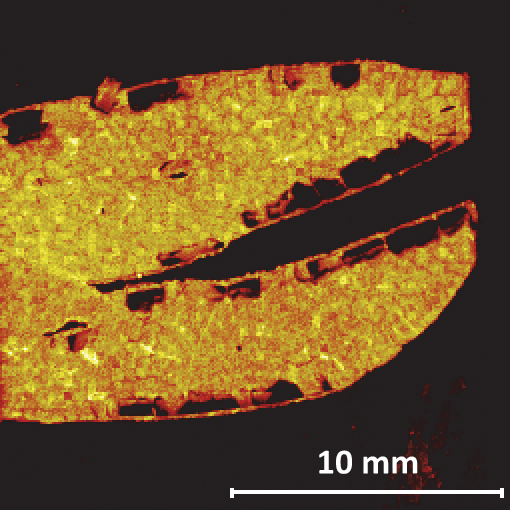
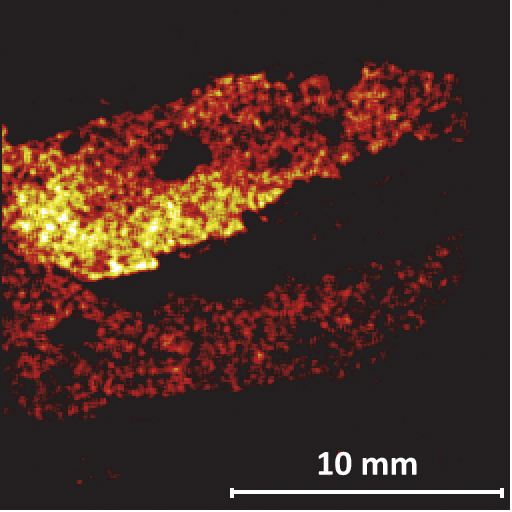
Shown below are TOF-SIMS images from a rat liver tissue section. The image on the left is for a phospholipid from the liver showing an expected uniform distribution. The image on the right is for the molecular ion of the drug and shows areas of the liver with preferential uptake of the drug.
Molecular images of a rat liver section for a phospholipid (m/z 184) on the left and the molecular ion of the drug on the right. The 20 kV C60 ion source used to create these images provided the high sensitivity needed to image the drug molecular ion.
18725 Lake Drive East,
Chanhassen, MN 55317
© 2026 Physical Electronics, Inc. (PHI)
All Rights Reserved.
© 2026 Physical Electronics, Inc. (PHI)
All Rights Reserved.